
For the technically minded · Architecture and control logic
How HELYQ decides
where energy flows and when.
A WAGO PLC combines the electrical measurements with weather forecasts, quarter-hourly tariffs and the boilers' charging demand. From this, the configurable CODESYS software coordinates consumption, storage and feed-in.
01 / System and energy paths
Two forms of storage.
Different tasks.
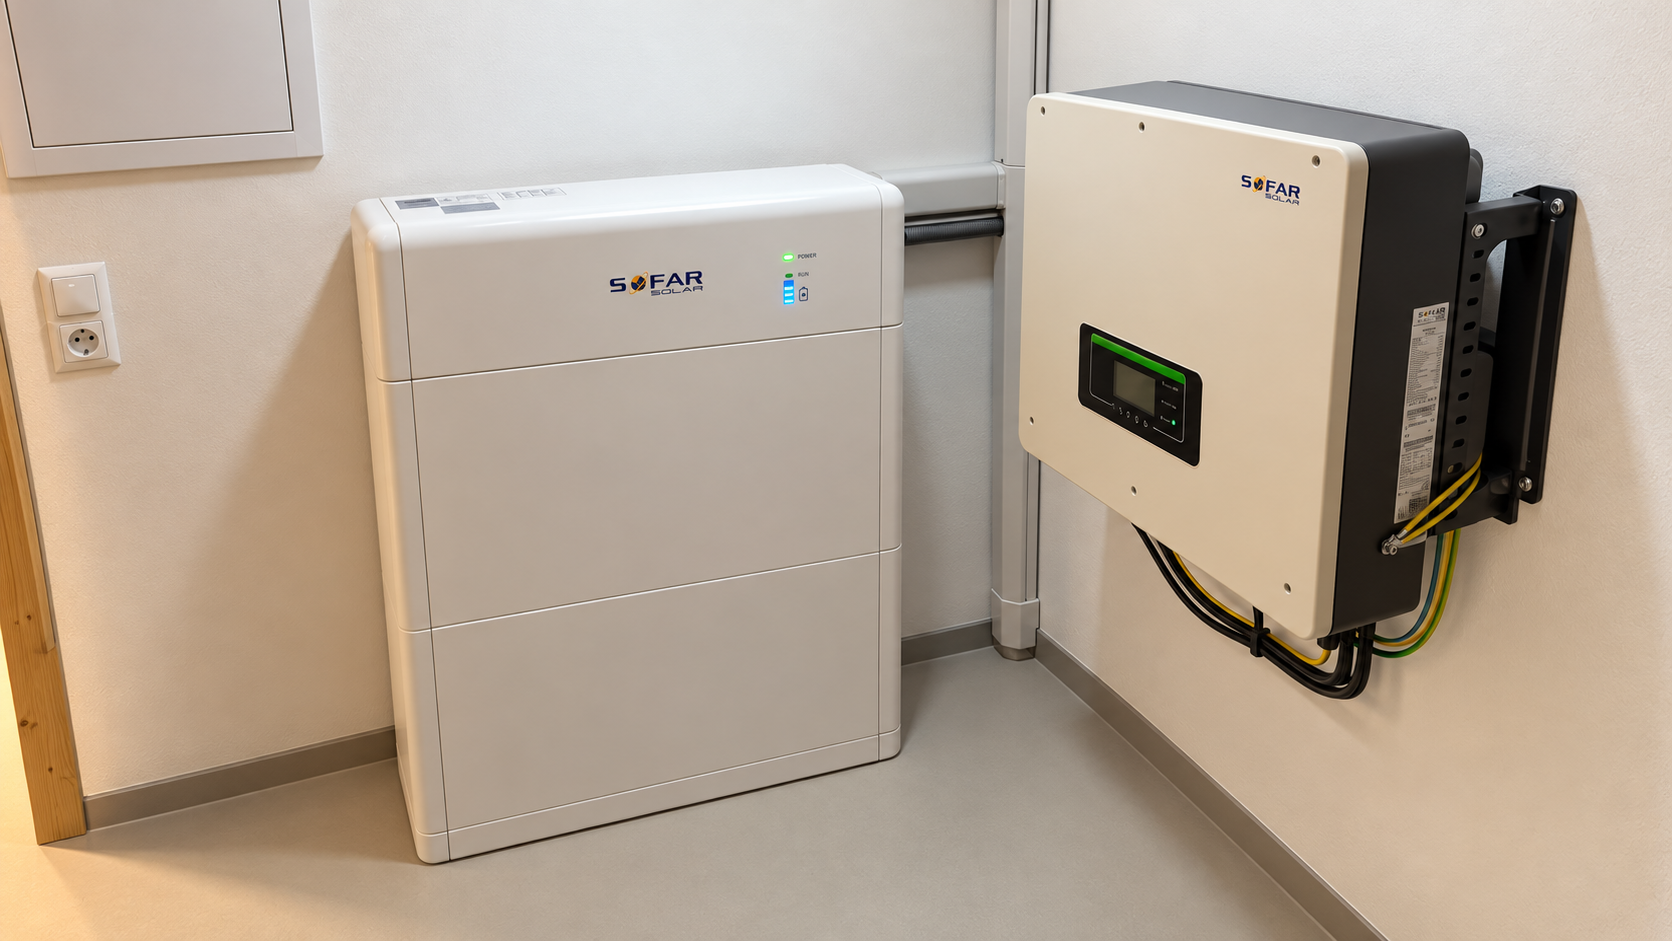
The PV system supplies the connected building grid via the hybrid inverter. There, the boilers take up electrical energy and store it as heat. The high-voltage battery is connected on the DC side of the inverter and supplies electrical energy again later.
The battery supports communal loads such as lighting, heating and the circulation pump, the shared coin-operated tumble dryer and the two holiday apartments when in use. When sufficiently charged, the usable 8 kWh last for one night under a typical load.
The separate electricity connections of the permanently rented apartments remain in place. Their boilers are included in the shared energy system.
| Component | Implementation in the project |
|---|---|
| Building | 7 apartments: 5 permanently rented, 2 holiday apartments used from time to time; Upper Styria, approx. 600 m above sea level |
| PV system | 11 kWp, south-facing, approx. 50° roof pitch |
| Observed maximum daily yields | About 65 kWh in summer and 45 kWh in winter in suitable weather; not average daily values |
| Inverter | SOFAR, three-phase, 15 kW maximum, 2 PV strings, hybrid unit |
| High-voltage battery | SOFAR, 10 kWh nominal; 8 kWh usable at 20–100% state of charge |
| Hot water | 7 electric boilers, each switched and metered individually |
| Controller | WAGO PLC; programmed in CODESYS; configurable control |
The PLC processes information and controls devices. The power current does not flow through the controller.
02 / Measuring and looking ahead
Local measurements.
External forecasts.
MODBUS RTU
The inverter, battery and energy meters are connected via MODBUS RTU at 19,200 baud. A single-phase energy meter up to 100 A is provided per boiler; another meter records the communal power.
Among other things, the controller reads voltage, current, power and frequency. The inverter provides data on PV power and string voltages. For the battery, voltage, charging and discharging current as well as state of charge and state of health are displayed, among other values.
Weather and tariffs via APIs
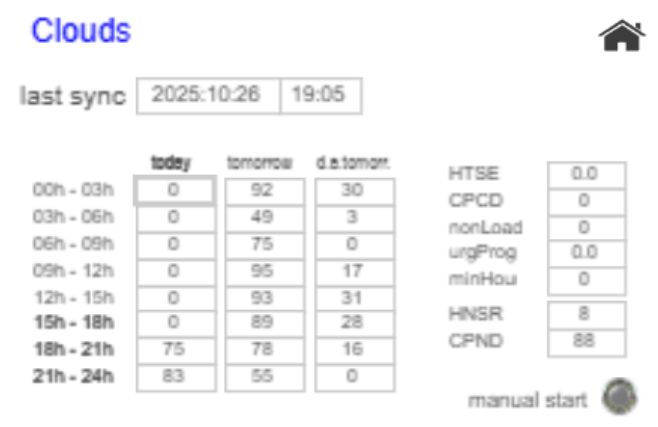
The cloud-cover forecast covers the current day and the following three days. Between sunrise and sunset, it is queried hourly.
Electricity tariffs are also retrieved hourly. Quarter-hourly values should be available for the current day and – once published, typically from around 6 p.m. – for the following day.
A cloud-cover forecast supports the expected solar yield; it is not a measurement of the energy actually generated.
03 / Switching within defined limits
Every boiler individually.
The distribution as a whole.
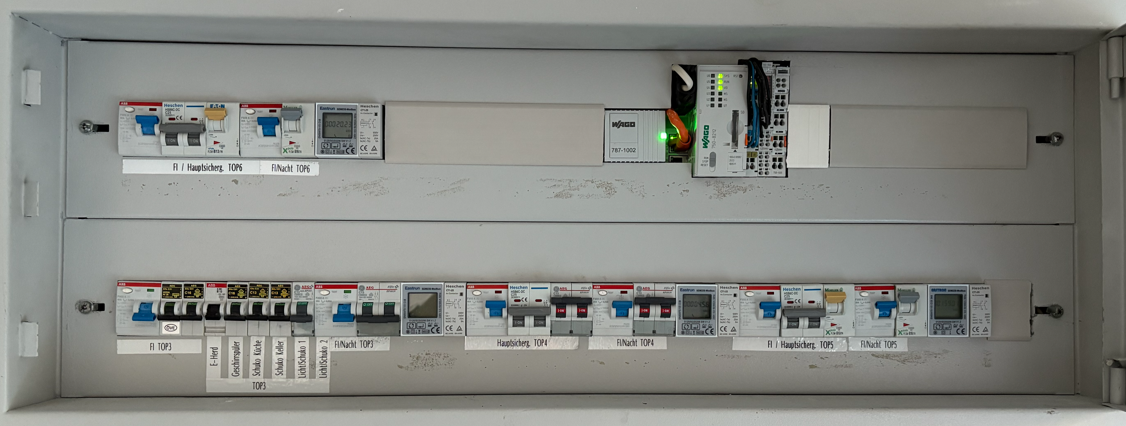
Each boiler has its own contactor. The project uses single-pole 32 A contactors. The rated electrical power of each boiler is stored as a parameter.
Boilers can be combined into distribution groups. For each group, a maximum simultaneously switched-on power is defined – for example 6 kW for an existing distribution section. These groups are independent of the inverter's two PV strings.
In addition, two separate parameters limit the total power of simultaneously switched-on boilers and the permissible grid import power.
A configured minimum on-time prevents a boiler from being switched off again within five minutes during normal control operation and reduces unnecessary switching operations.
The power limits must match the actual installation. The controller complements load management; electrical protective devices and professional dimensioning remain necessary.
04 / Boiler charging
Bringing hot-water demand
and solar supply together.
Detecting the end of charging electrically
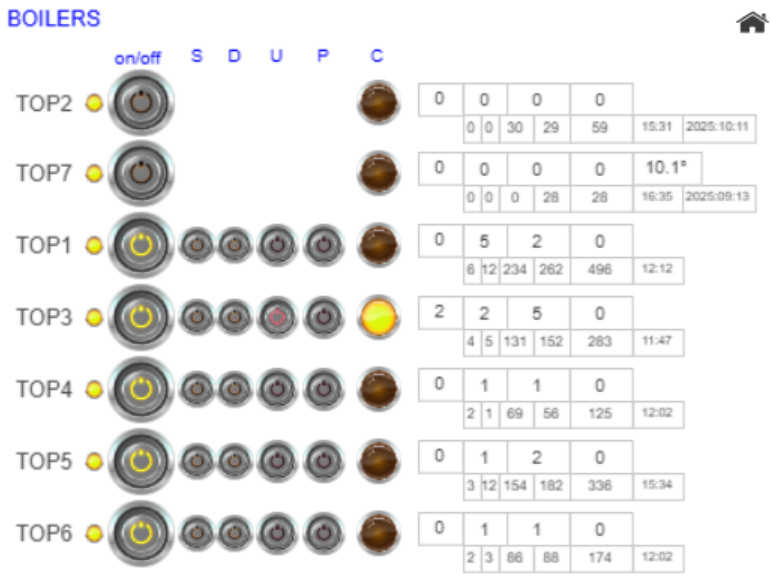
When a released boiler is switched on, the controller observes its current draw. If voltage is present and no current flows any more, it marks the boiler as charged. This way, the switch-off by the existing boiler thermostat is used without installing an additional temperature measurement at each boiler.
Charge detection is based on electrical behaviour. It does not replace a direct measurement of the water temperature. Boiler TOP7 additionally has a temperature sensor because it was easy to install there.
Automatic daily supply
In automatic control, at least one full charge should have taken place after 12 noon. If this has not been achieved by sunset, charging is topped up from the battery or the grid.
In the afternoon, the forecast for the following day influences further charging. If little solar yield is expected, the boiler can charge even when the current PV power is below its rated power. The remaining energy is added. If sufficient solar yield is expected and the boiler has already been fully charged after noon, further charging only takes place if PV covers it completely. This leaves more battery capacity available for other loads.
Three selectable charging modes
| Charging mode | Behaviour |
|---|---|
| Solar only | Charge when sufficient solar energy is available and other boilers are already charged. |
| One-off charge | An immediate, one-time charge. It is also triggered automatically when a boiler circuit previously switched off at the distribution board is energised again. |
| Permanent charging | The controller aims to charge regardless of time of day and solar yield, for example when demand is temporarily higher in a holiday apartment. |
In addition, each boiler can be switched on or off. The charging modes respect the configured power limits.
Targeted special charge for higher demand
A daily special charge can take place at a set time – for example at 11 p.m. with a maximum charging energy of 4 kWh. This allows a boiler to be recharged specifically for particularly high hot-water demand, regardless of the current solar supply.
4 kWh refers to the amount of energy of the charging process. The electrical power and the permissible group and total power are considered separately.
05 / Feed-in and tariff control
Not every kilowatt-hour fed in
is worth the same.
In the project, electricity is purchased at a fixed tariff. The energy component is 14 ct/kWh; including grid charges and other components, around 45 ct/kWh is assumed. Feed-in, by contrast, is subject to a dynamic tariff with quarter-hourly metering.
The payment corresponds to the agreed reference price minus 2 ct/kWh. A configurable price limit makes it possible to control feed-in economically.
Using a favourable window in the morning
If the expected solar generation of the new day exceeds 30 kWh and a price below the set threshold is expected for more than two hours, power is fed in deliberately in the morning hours. Boiler and battery charging can be postponed for this.
The 30 kWh threshold refers to the expected daily energy. It is not an instantaneous power threshold.
Limiting feed-in at low tariffs
If the reference price falls below the set limit – 2 ct/kWh in the example – the inverter is switched to zero-export mode. Energy can be consumed or stored on site within the permissible operating limits. Surpluses that cannot be absorbed are curtailed.
At a reference price of 2 ct/kWh and a deduction of 2 ct/kWh, the calculated feed-in payment is zero; below that it is negative. Tariff control is therefore particularly relevant with a dynamic feed-in contract.
The limitation reduces feed-in during these time windows. The aim is a higher economic benefit from the energy generated and less strain on the grid from avoidable surpluses.
06 / Operation, evaluation and expansion
Understanding operation.
Tracing consumption.
Remote overview
The system overview is accessible via the internet. It shows boiler states, charging modes and parameters as well as API status, inverter and battery data. It is used to operate and monitor the system.
Daily and monthly data
Daily values and twelve rolling months are kept for each energy meter. These include month-end readings and consumption shares from grid, battery and PV. For the overall system, PV yield and energy use for hot water as well as communal power and connected apartments are evaluated.
Daily charging times, energy consumption and switching operations are available for each boiler. Monthly reports are sent by email; an error log and error notifications support operation.
The allocation to PV, battery and grid results from the system evaluation. An individual consumer meter initially measures the total electrical consumption of the connected load.
Configuration
- MODBUS communication and assigned devices
- Apartments and electrical distribution groups
- Number of boilers, rated power and group assignment
- Energy meters and metering assignment
- Weather and tariff APIs and location
- Power limits, charging modes and special charges
- Sender and recipients for monthly reports and error notifications
Additional building data
An M-Bus module logs the heat meters monthly and sends the readings by email. This is remote meter reading, not heating control.
A Pt1000 module records outdoor, heating flow and return temperatures as well as the temperature at boiler TOP7. Further displays can build on this infrastructure.
A question about the control logic?
I'm interested in exchanging ideas about similar buildings, specific technical questions and experience from installation.
Ask a technical question